Advanced Image Analysis
Staff at our center will reconstruct and co-register most SPECT, PET and CT images using standard protocols. However, based on the need of the users, specific reconstruction and co-registration protocols can be requested.
A high-speed workstation installed in Room 176, Cancer Research Building II, with appropriate software and ultra high speed graphics card for reconstruction, data retrival and advanced image analysis will be available to all users. Also, note that in general, all multi-modality images will be automatically co-registered and available to the user.
Amira (Visage Imaging) for advanced image processing will be available on the workstation. Amira can import and export standard image formats, use various ways of visualizing images, provide tools for analysis and measurement (statistics, co-localization analysis, arithmetic operations, segmentation, image registration) and allow scripting and integration with MATLAB (commonly used high-level language and interactive environment to perform computationally intensive tasks). Examples of advanced image analyses are shown below:
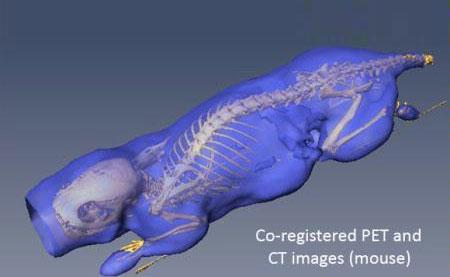
Co-registered [18F]FDG-PET/CT images (mouse). The isosurface (purple) and skeleton (yellow) were extracted from the PET and CT images respectively.
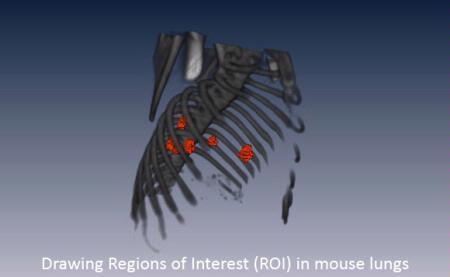
Regions of Interest (ROI) (red) in the lungs of a mouse. The skeleton (grey) was extracted from the CT images. Image parameters and statistics for the ROIs can be extracted from the CT or any other imaging modality co-registered to this CT.
Amira is provided for the convenience of the user on the center’s workstation at no additional cost. Training modules are available on the workstation. Request for additional training or data analyses can be made to the center but will be at an additional cost. AMIDE is a completely free, basic image analysis tool for viewing, analyzing, and registering volumetric imaging data sets and can be used instead of Amira.
Disclaimer: Note that the center or its members do not endorse Amira or Visage Imaging products and do not have any financial or other relationship with Visage Imaging.
Computational Analysis
Computational analysis that provide statistically meaningful data with attached p-value from imaging experiments will be extremely useful for rigorous image analysis. This will reduce user intervention and therefore save significant amount of time and minimize operator dependent biases. These services will also allow image analysis for large studies where several image sets are followed over time. The following services will also be available at an additional fee:
- Image Set Registration In order to robustly follow the evolution of lesions (tumors, etc), image sets across time-points need to be co-registered such that voxels on each image set match all the other imaging set. This requires correction for the spatial orientation of the animal at the time of image acquisition. To achieve this, we have developed methods to align each CT image and its corresponding PET / SPECT image to a common reference. After registration, a one-to-one correspondence between all CT, PET or SPECT images is achieved making it possible to trace a region of interest (ROI) in one image and extract activities at corresponding locations across time-point.*
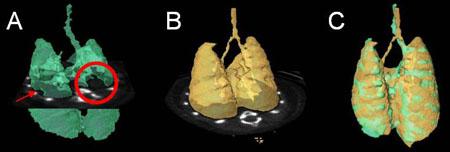
Segmentation of TB-infected mouse lungs from CT images. A. Partial segmentation of infected lungs. Filling defects appear in lieu of lesions (red arrow and circle). B. Complete segmentation of healthy lungs (template). C. Registration of the complete template shape (B) onto the incomplete segmentation (A) fills these defects. Notice also how the contours of the segmented (C) and template (B) lungs are aligned.
- Statistical Analysis of Molecular Imaging. We use the controls to build a statistical model under the null hypothesis for the statistic of interest. For example, we use as controls the CT and PET of healthy subjects and use as statistic the maximum intensity of the PET within the lungs. We register together the controls and estimate the distribution of this statistic over healthy subjects. This in turn permits to compute a p-value assessing if a subject is infected.
- Segmentation of tumors and lesions. We provide automated or semi-automated unbiased methods for landmark detection in 2D and 3D images. These methods will reduce user intervention and therefore save significant amount of time and minimize operator dependent biases.

Detection of TB granulomas in mouse lungs. Left: Segmentation of (infected) lungs from CT. Right: Statistically significant regions of inflammation from the corresponding co-registered [18F]FDG-PET.
*Vidal C, Hewitt J, Davis S, Younes L, Jain S, Jedynak B. Template Registration with missing parts: Application to the Segmentation of Tuberculosis infected lungs. Proceedings of the IEEE International Symposium on Biomedical Images (in press).
The Center for Infection and Inflammation Imaging Research is located within the vivarium of the Cancer Research Building-II. Please contact us with any questions or concerns at 410-614-9051 or 410-614-3051.